These SUV market statistics show how utility vehicles continue to take a larger share of the global car market. The latest data points to stronger SUV penetration in Europe and the United States, a continued shift toward utility-focused lineups, and a growing SUV presence inside the electric-car market.
SUV Market Statistics (Top Highlights)
- Global passenger car sales were 72.8 million in 2023 and 74.6 million in 2024.
- SUVs made up 46% of global car sales in 2022 and 48% in 2023.
- At a 48% share of 72.8 million passenger car sales, SUVs represented an estimated 34.94 million global sales in 2023.
- The EU market reached a 51% SUV share in 2023.
- In the United States, car SUVs and truck SUVs together accounted for about 60% of all new vehicle production in model year 2024.
- Truck SUVs alone now account for about half of all new vehicle production in the U.S.
- The truck regulatory class reached 66% of U.S. new vehicle production in model year 2024.
- There were more than 360 million SUVs on roads worldwide in 2023, producing about 1 billion tonnes of combustion-related CO2.
- Only 5% of SUVs on the road are electric, but 16% of SUV sales were electric in 2022 and more than 55% of new electric car registrations in 2023 were SUVs.
- In the first five months of 2025, compact utilities held 21% of the U.S. new-vehicle market, upper midsize utilities held 12.3%, and sub-compact plus utilities held 9.2%.
Global SUV share of car sales
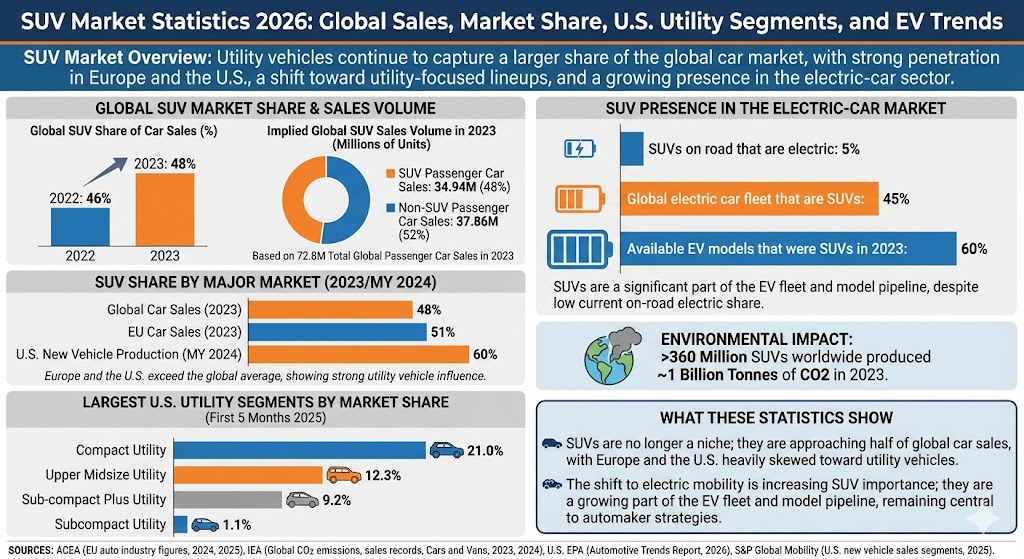
The global SUV share continued to climb in the latest published IEA data, moving from 46% of car sales in 2022 to 48% in 2023.
| Label | Bar | Value | ||
|---|---|---|---|---|
| 2022 | 46% | |||
| 2023 | 48% |
Max = 48%. Widths: 2022 95.83%, 2023 100.00%
Implied global SUV sales volume in 2023
Using the 48% SUV share and 72.8 million global passenger car sales in 2023, SUVs accounted for an estimated 34.94 million sales, compared with about 37.86 million non-SUV passenger car sales.
| Label | Bar | Value | ||
|---|---|---|---|---|
| SUV passenger car sales | 34.94M | |||
| Non-SUV passenger car sales | 37.86M |
Max = 37.86M. Widths: SUV passenger car sales 92.29%, Non-SUV passenger car sales 100.00%
SUV share by major market
Europe and the United States both sit above the latest global average, showing how strongly SUVs and utility vehicles now shape mature auto markets.
| Label | Bar | Value | ||
|---|---|---|---|---|
| Global car sales, 2023 | 48% | |||
| EU car sales, 2023 | 51% | |||
| U.S. new vehicle production, MY 2024 | 60% |
Max = 60%. Widths: Global car sales, 2023 80.00%, EU car sales, 2023 85.00%, U.S. new vehicle production, MY 2024 100.00%
Largest U.S. utility segments by market share
S&P Global Mobility data shows that utility categories dominate the U.S. market structure, especially compact and three-row utility segments.
| Label | Bar | Value | ||
|---|---|---|---|---|
| Compact utility | 21.0% | |||
| Upper midsize utility | 12.3% | |||
| Sub-compact plus utility | 9.2% | |||
| Subcompact utility | 1.1% |
Max = 21.0%. Widths: Compact utility 100.00%, Upper midsize utility 58.57%, Sub-compact plus utility 43.81%, Subcompact utility 5.24%
SUV presence in the electric-car market
Even though only a small share of SUVs already on the road are electric, SUVs now represent a large portion of the electric-car fleet, model pipeline, and new EV registrations.
| Label | Bar | Value | ||
|---|---|---|---|---|
| SUVs on road that are electric | 5% | |||
| Global electric car fleet that are SUVs | 45% | |||
| Available EV models that were SUVs in 2023 | 60% |
Max = 60%. Widths: SUVs on road that are electric 8.33%, Global electric car fleet that are SUVs 75.00%, Available EV models that were SUVs in 2023 100.00%
What these SUV market statistics show
The SUV market is no longer a niche within passenger vehicles. Globally, SUVs are approaching half of all car sales, Europe has already moved above that level, and the U.S. production mix is even more heavily skewed toward utility vehicles.
The other major pattern is that the shift to electric mobility is not reducing the importance of SUVs. Instead, SUVs are becoming a larger part of the EV fleet and model pipeline, which suggests the segment will remain central to automaker product strategy even as powertrains change.
Sources
- ACEA, Key figures on the EU auto industry, September 2024
- ACEA, Economic and Market Report: Global and EU auto industry, full-year 2024, March 2025
- IEA, As their sales continue to rise, SUVs’ global CO2 emissions are nearing 1 billion tonnes, February 2023
- IEA, SUVs are setting new sales records each year and so are their emissions, May 2024
- IEA, Cars and Vans
- U.S. EPA, Highlights of the Automotive Trends Report, February 2026
- U.S. EPA, The 2025 Automotive Trends Report, February 2026
- S&P Global Mobility, Four segments drive over half of U.S. new vehicle sales, July 2025