These auto loan statistics highlight the latest U.S. benchmarks on outstanding balances, delinquency, monthly payments, loan sizes, interest rates, and borrower pressure points. Most of the freshest public figures currently available were published in 2025 and early 2026, with many core credit metrics reported through Q4 2025.
Auto Loan Statistics (Top Highlights)
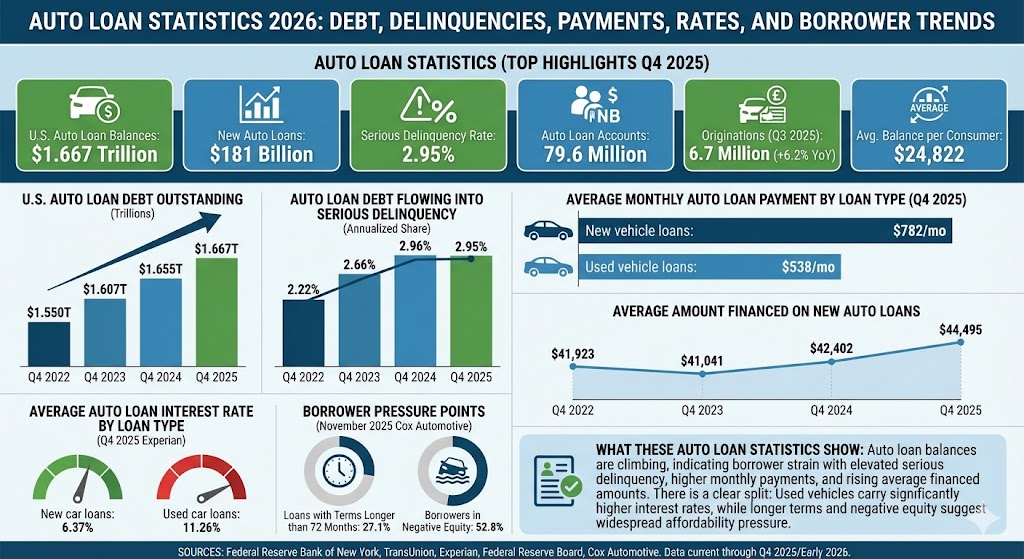
- U.S. auto loan balances reached $1.667 trillion in Q4 2025.
- New auto loans appearing on consumer credit reports totaled $181 billion in Q4 2025.
- The flow of auto loan debt into serious delinquency was 2.95% in Q4 2025.
- That 2.95% reading stayed near the 2.96% level recorded in Q4 2024 and above the 2.22% level seen in Q4 2022.
- TransUnion counted 79.6 million auto loan accounts in Q4 2025.
- Auto loan originations were 6.7 million in Q3 2025, up 6.2% year over year.
- Average monthly payments reached $782 for new vehicles and $538 for used vehicles in Q4 2025.
- Average amount financed reached $44,495 for new vehicles and $27,278 for used vehicles in Q4 2025.
- Average auto loan balance per consumer reached $24,822 in Q4 2025.
- Experian’s Q4 2025 benchmark put the average new-car loan amount at $43,582 with a 6.37% interest rate.
- Experian’s Q4 2025 benchmark put the average used-car loan amount at $27,528 with an 11.26% interest rate.
- The Federal Reserve’s G.19 series showed 60-month new-car loan rates at commercial banks averaged 7.22% in Q4 2025, down from 8.04% in Q1 2025.
- The same Fed series showed average amount financed on new car loans at finance companies at $41,742 in Q4 2025.
- Cox Automotive said 27.1% of loans in November 2025 had terms longer than 72 months.
- Cox Automotive also found 52.8% of borrowers were in negative equity in November 2025.
U.S. Auto Loan Debt Outstanding
| Label | Bar | Value | ||
|---|---|---|---|---|
| Q4 2022 | $1.550T | |||
| Q4 2023 | $1.607T | |||
| Q4 2024 | $1.655T | |||
| Q4 2025 | $1.667T |
Max = $1.667T. Widths: Q4 2022 92.98%, Q4 2023 96.40%, Q4 2024 99.28%, Q4 2025 100.00%
Auto Loan Debt Flowing Into Serious Delinquency
This measure tracks the annualized share of balances that newly became 90 or more days delinquent.
| Label | Bar | Value | ||
|---|---|---|---|---|
| Q4 2022 | 2.22% | |||
| Q4 2023 | 2.66% | |||
| Q4 2024 | 2.96% | |||
| Q4 2025 | 2.95% |
Max = 2.96%. Widths: Q4 2022 75.00%, Q4 2023 89.86%, Q4 2024 100.00%, Q4 2025 99.66%
Average Monthly Auto Loan Payment by Loan Type
| Label | Bar | Value | ||
|---|---|---|---|---|
| New vehicle loans | $782/mo | |||
| Used vehicle loans | $538/mo |
Max = $782/mo. Widths: New vehicle loans 100.00%, Used vehicle loans 68.80%
Average Amount Financed on New Auto Loans
| Label | Bar | Value | ||
|---|---|---|---|---|
| Q4 2022 | $41,923 | |||
| Q4 2023 | $41,041 | |||
| Q4 2024 | $42,402 | |||
| Q4 2025 | $44,495 |
Max = $44,495. Widths: Q4 2022 94.22%, Q4 2023 92.24%, Q4 2024 95.30%, Q4 2025 100.00%
Average Auto Loan Interest Rate by Loan Type
| Label | Bar | Value | ||
|---|---|---|---|---|
| New car loans | 6.37% | |||
| Used car loans | 11.26% |
Max = 11.26%. Widths: New car loans 56.57%, Used car loans 100.00%
What These Auto Loan Statistics Show
Auto loan balances are still climbing, but the more important signal is borrower strain. Serious delinquency remains close to 3%, monthly payments are elevated, and average financed amounts have continued to rise.
The market is also showing a split between new and used financing. Used vehicles still carry notably higher interest rates, while longer loan terms and negative equity remain common, which suggests affordability pressure is still a defining theme in the auto loan market.
Sources
- Federal Reserve Bank of New York, Quarterly Report on Household Debt and Credit, Q4 2022, Q4 2023, Q4 2024, and Q4 2025
- TransUnion, Q1 2025 Credit Industry Insights Report and Q4 2025 Quarterly Credit Industry Insights Report
- Experian, State of the Automotive Finance Market update published March 5, 2026
- Federal Reserve Board, Consumer Credit G.19 historical terms of credit tables
- Cox Automotive, Dealertrack Credit Availability Index, November 2025