These automotive emissions statistics show how much road vehicles still contribute to climate pollution, how those emissions are distributed across vehicle types, and how standards and electrification are changing the picture in major markets.
Automotive emissions statistics (Top Highlights)
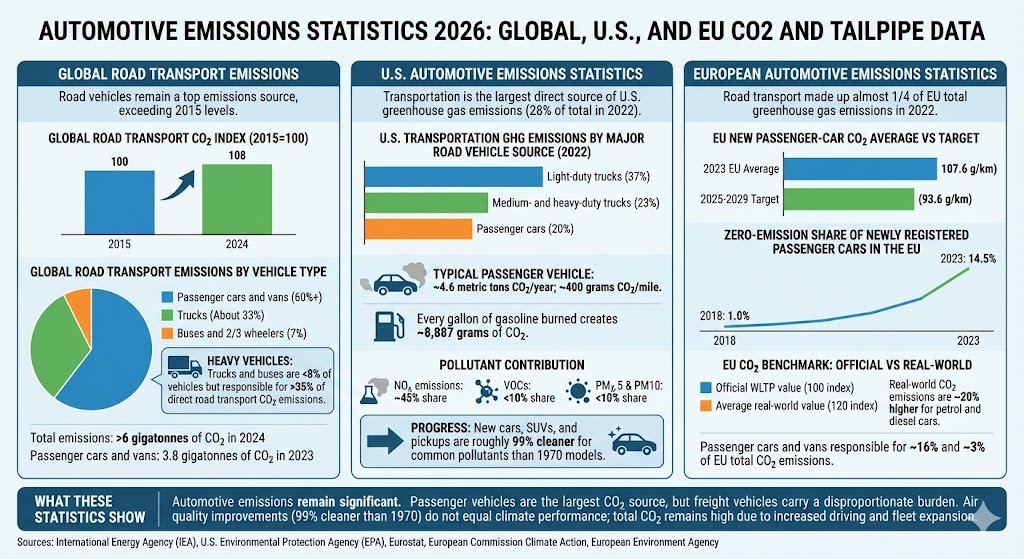
- Global road transport emissions were just over 6 gigatonnes of CO2 in 2024, which was 8% higher than in 2015.
- Passenger cars and vans produced 3.8 gigatonnes of CO2 in 2023 and accounted for more than 60% of road transport emissions.
- Trucks and buses make up fewer than 8% of vehicles globally but are responsible for more than 35% of direct road transport CO2 emissions.
- Transportation was the largest direct source of U.S. greenhouse gas emissions in 2022, accounting for 28% of the total.
- In the U.S. transportation sector, light-duty trucks made up 37% of emissions in 2022, medium- and heavy-duty trucks 23%, and passenger cars 20%.
- A typical passenger vehicle emits about 4.6 metric tons of CO2 per year in the United States.
- The average passenger vehicle in the U.S. emits about 400 grams of CO2 per mile driven.
- Transportation is responsible for about 45% of total U.S. nitrogen oxides emissions, while contributing less than 10% of VOCs and less than 10% of PM2.5 and PM10 emissions.
- Compared with 1970 vehicle models, new cars, SUVs, and pickup trucks are roughly 99% cleaner for common pollutants.
- Road transport was responsible for almost a quarter of the EU’s total greenhouse gas emissions in 2022.
- The average CO2 emissions of new passenger cars registered in the EU reached 107.6 g/km in 2023, the lowest level on record.
- The EU share of zero-emission vehicles in newly registered passenger cars rose from 1.0% in 2018 to 14.5% in 2023.
- Passenger cars and vans are responsible for around 16% and 3% of the EU’s total CO2 emissions, respectively.
- For petrol and diesel cars in Europe, real-world CO2 emissions are still around 20% higher than official WLTP values on average.
Global automotive emissions statistics
Road vehicles remain one of the biggest emissions sources in the transport system. The IEA says road sector emissions were just over 6 gigatonnes of CO2 in 2024, and the sector is still above its 2015 level. Passenger cars and vans remain the largest single contributor, while freight vehicles continue to carry an outsized emissions burden relative to their share of the vehicle fleet.
Global road transport CO2 index
| Label | Bar | Value | ||
|---|---|---|---|---|
| 2015 | 100 | |||
| 2024 | 108 |
Max = 108. Widths: 2015 92.59%, 2024 100.00%
Global road transport emissions by vehicle type
| Label | Bar | Value | ||
|---|---|---|---|---|
| Passenger cars and vans | 60%+ | |||
| Trucks | About 33% | |||
| Buses and 2/3 wheelers | 7% |
Max = 60%. Widths: Passenger cars and vans 100.00%, Trucks 55.00%, Buses and 2/3 wheelers 11.67%
The global mix also shows why heavy vehicles matter so much in climate policy. The IEA says trucks and buses are responsible for more than 35% of direct road transport CO2 emissions even though they represent fewer than 8% of vehicles, which is why truck standards and zero-emission freight policies have become a major focus.
U.S. automotive emissions statistics
In the United States, transportation remains the largest direct source of greenhouse gas emissions. Within that total, road vehicles dominate, especially light-duty trucks such as SUVs, pickups, and minivans. Tailpipe pollution has dropped sharply over the last several decades, but the sector still produces a large share of national climate emissions and a major share of nitrogen oxides.
U.S. transportation greenhouse gas emissions by major road vehicle source
| Label | Bar | Value | ||
|---|---|---|---|---|
| Light-duty trucks | 37% | |||
| Medium- and heavy-duty trucks | 23% | |||
| Passenger cars | 20% |
Max = 37%. Widths: Light-duty trucks 100.00%, Medium- and heavy-duty trucks 62.16%, Passenger cars 54.05%
EPA says a typical passenger vehicle emits about 4.6 metric tons of CO2 per year and about 400 grams of CO2 per mile. Every gallon of gasoline burned creates about 8,887 grams of CO2. At the same time, transportation is responsible for around 45% of U.S. NOx emissions, even though its share of VOC and particulate emissions is much lower. That combination explains why automotive emissions still matter for both climate and air quality.
There is also a long-run policy success story in conventional tailpipe pollution. EPA says new cars, SUVs, and pickup trucks are roughly 99% cleaner for common pollutants than 1970 vehicle models, showing how much emissions-control technology has improved even while climate emissions remain a challenge.
European automotive emissions statistics
Europe shows both progress and remaining gaps. Average emissions from new passenger cars have fallen sharply, zero-emission vehicle sales have grown, and standards continue to tighten. Even so, road transport still makes up almost a quarter of total EU greenhouse gas emissions, and real-world fuel use and CO2 output still exceed official laboratory values for many vehicles.
EU new passenger-car CO2 average vs 2025 to 2029 target
| Label | Bar | Value | ||
|---|---|---|---|---|
| 2023 EU average | 107.6 g/km | |||
| 2025 to 2029 target | 93.6 g/km |
Max = 107.6 g/km. Widths: 2023 EU average 100.00%, 2025 to 2029 target 86.99%
Zero-emission share of newly registered passenger cars in the EU
| Label | Bar | Value | ||
|---|---|---|---|---|
| 2018 | 1.0% | |||
| 2023 | 14.5% |
Max = 14.5%. Widths: 2018 6.90%, 2023 100.00%
EU petrol and diesel car CO2 benchmark: official vs real-world
| Label | Bar | Value | ||
|---|---|---|---|---|
| Official WLTP value | 100 index | |||
| Average real-world value | 120 index |
Max = 120 index. Widths: Official WLTP value 83.33%, Average real-world value 100.00%
Eurostat says road transport was responsible for almost a quarter of the EU’s total greenhouse gas emissions in 2022, and more than half of road transport emissions came from passenger cars. The European Commission also reports that passenger cars and vans account for around 16% and 3% of the EU’s total CO2 emissions. That makes road vehicles central to Europe’s climate targets even as new registrations become cleaner.
What these automotive emissions statistics show
The main takeaway is that automotive emissions are still large in absolute terms, even after major improvements in fuel economy, tailpipe controls, and electric vehicle adoption. Passenger vehicles remain the largest source of road transport CO2, but freight vehicles produce a disproportionately large share of emissions and therefore matter heavily in any decarbonization plan.
The second takeaway is that air-pollution performance and climate performance are not the same thing. New vehicles are far cleaner than older models for pollutants such as NOx, hydrocarbons, and particulates, but total CO2 emissions remain elevated because people drive more, larger vehicles remain popular, and the global fleet keeps expanding. That is why emissions standards, electrification, and fuel-efficiency gains all still matter at the same time.
Sources
- International Energy Agency, Breakthrough Agenda Report 2025: Road Transport
- International Energy Agency, Cars and Vans
- International Energy Agency, Trucks and Buses
- U.S. Environmental Protection Agency, Transportation Sector Emissions
- U.S. Environmental Protection Agency, Fast Facts on Transportation Greenhouse Gas Emissions
- U.S. Environmental Protection Agency, Greenhouse Gas Emissions from a Typical Passenger Vehicle
- U.S. Environmental Protection Agency, Smog, Soot, and Other Air Pollution from Transportation
- U.S. Environmental Protection Agency, Accomplishments and Successes of Reducing Air Pollution from Transportation in the United States
- Eurostat, SDG 13 Climate Action
- European Commission Climate Action, Cars and Vans
- European Commission Climate Action, CO2 Emissions from New Cars and Vans Continued to Decrease in 2023
- European Commission Climate Action, Publication of Real-World CO2 Emissions and Fuel Consumption of Cars and Vans Collected in 2022
- European Environment Agency, Greenhouse Gas Emissions from Transport in Europe